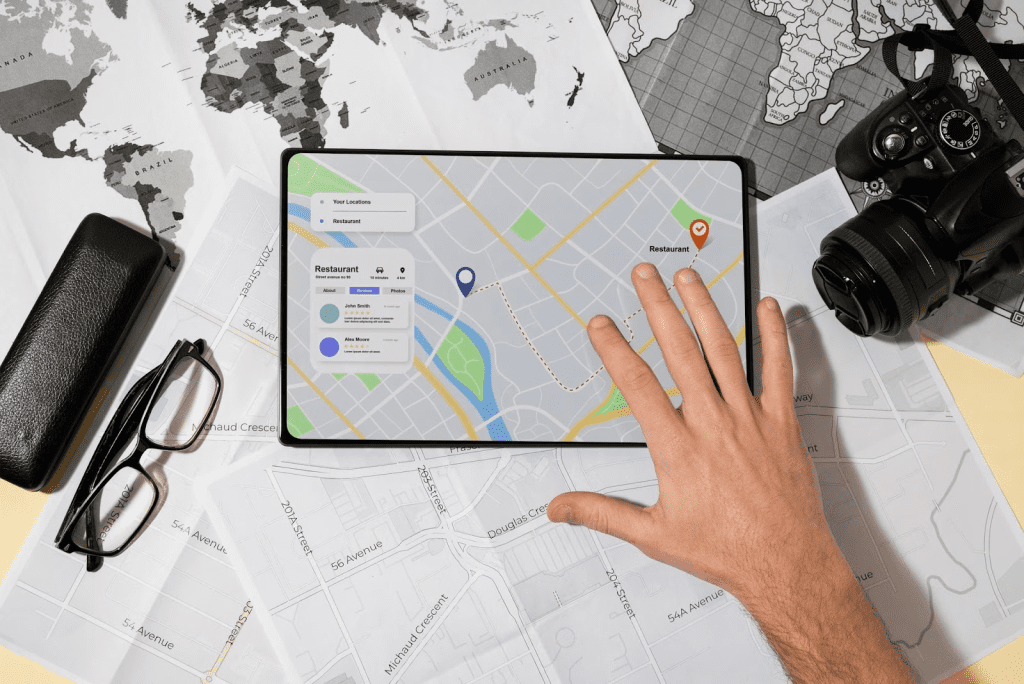
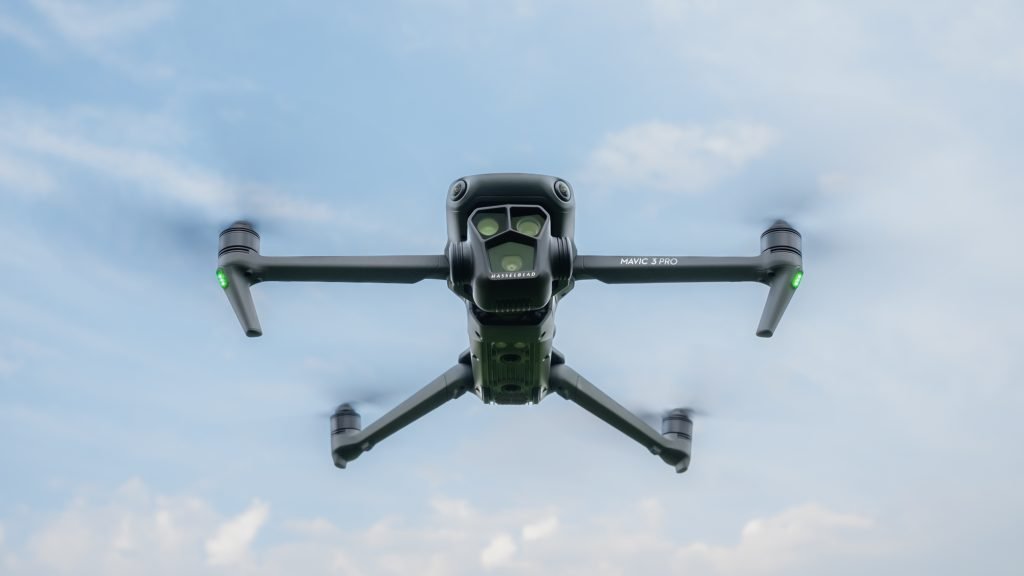
Geospatial data gives insight and perspectives into our world to analyse and understand our environment. It has changed our world perception for centuries, from mapping techniques on physical models to today’s state-of-the-art technology.
The three types of geospatial data—vector, raster, and geospatial imagery—all offer unique benefits that can be utilised. It is used in engineering, agriculture, defence, meteorology, and other fields. We’ll explore each geospatial data type more to understand how they are used.
What Is Geospatial Data?
Satellite imagery, aerial photographs, survey data, and other forms of data collect geospatial data in a specific demographic location that can be linked to a particular area on the Earth’s surface. Examples of geospatial data include digital elevation models (DEMs), street maps, land cover information, agricultural boundaries, and water resources. It is also used in transportation planning, air quality monitoring and disaster management.
How Does It Work?
Geospatial data consists of coordinates or addresses that are associated with physical locations. It plots those locations on a map or chart, and they can be used to query, analyse and visualise data. Geospatial data is collected using GPS receivers, survey instruments, aerial photography and satellite imagery. It is then converted into GIS (Geographical Information System) or CAD (Computer-Aided Design), which manipulates and analyses the data.
Urban planning, natural resource management, public safety and emergency response use geospatial data. It understands the relationship between locations and features on a map or chart to identify correlations between physical places and other environmental or demographic factors.
Geospatial Data Types: Vector, Raster, and Geospatial Imagery
Geospatial data includes various information types: point-based vector data, raster image data, and geospatial imagery.
Vector Data
Vector data stores geometric information like points, lines, and polygons. It consists of points connected by lines forming polygons, representing ground features. A point might represent a school building, while lines can represent roads, rivers or other linear features. Polygons can be used to define an area, such as a forested region.
Some common applications of vector data include creating navigation maps for vehicles and smartphones, creating 3D visualisations of buildings and terrain, making interactive web maps, and conducting geographic analysis.
Advantages
- The ability to represent all types of features in a single layer of data
- Compact storage since the data is stored in its simplest form
- It is easy to query and manipulate
- It can be accurately displayed on mobile phones and desktop computers
Disadvantages
- Difficult to represent complex features, such as a large area of land or coastline
- Requires more storage space than raster data since it has to store many points for each feature
- It is difficult to display small details on various computer systems accurately
Raster Data
Raster data is collected from satellite imagery, aerial photography and other sources, consisting of individual layers combined to form a single raster dataset. The raster image comprises cells arranged in a grid pattern; each cell contains a value. It represents elevation, land cover, soil types, and many more features of the Earth’s surface.
Some of the applications of raster data are environmental settings, mapping urban infrastructure, modelling water resources, and forestry and agriculture.
Advantages
- Data compression techniques can reduce storage space requirements
- Raster data precisely represent the ground surface and can represent complex features, such as an area of land or coastline
- It is easily displayed on most computer systems, including mobile phones and desktop computers
Disadvantages
- It is difficult to query and manipulate data since it is stored in a grid format.
- It requires more storage space than vector data because it has to store all the values for each cell in the grid
- The accuracy can be affected by the resolution of the raster image
Geospatial Imagery
Geospatial imagery involves capturing images of the Earth’s surface from aerial or satellite platforms to represent physical objects and landscapes visually. Elevation, terrain, vegetation cover, water bodies, structures, roads and other features can be identified from the images to monitor changes in its environment over time.
Geospatial imagery is created using cameras, radar systems, LiDAR (Light Detection and Ranging) scanners and multi-spectral sensors. It is used for military intelligence gathering, surveillance activities and border control. It can also identify historical sites, archaeological discoveries and wildlife habitats. Common applications include agricultural monitoring, urban planning, disaster management, forestry management, natural resource exploration, and transportation planning.
Advantages
- Ability to collect detailed data on a large scale, a better understanding of the environment and improved decision-making capabilities
- Requires minimal workforce
- Provides data that can be updated regularly to reflect changes in an area over time
Disadvantages
- Difficult to interpret due to the volume of information
- Costly to acquire higher-quality data
- There is potential for errors in the interpretation of the images due to inaccuracies in object identification or differences in scale
Why Is Geospatial Data Important?
Geospatial data visualises data by providing a unique view of the physical environment to understand the world around us better. It identifies patterns, trends, and relationships that would require help to recognise.
Better Decision Making
Geospatial data can provide an accurate and comprehensive view of an area to decide the best action for better outcomes.
Improved Analysis
Analysts identify patterns, trends, and correlations that would be difficult to discern with geospatial data. It provides a more holistic view of an area or region to inform policy decisions and research projects.
Enhanced Visualisation
Geospatial data creates interactive maps and 3D models that allow users to explore an area in a more realistic view of the physical environment.
Conclusion
Geospatial data makes you understand the physical environment and informs decision-making processes. Its application in various industries has revolutionised how information is collected, processed, and visualised. Geospatial data brings maps and data together in ways that would otherwise be impossible.
Michael C Vang is a passionate blogger. He has been blogging since 2013 on a variety of topics. He is committed to creating informative and engaging content that helps readers learn more about everything.


